LABIC - Bioinformatics and Computational Intelligence
Laboratory
Local Repository of Research Datasets
UTFPR-PFD: Protein Folding Pathways
Dataset
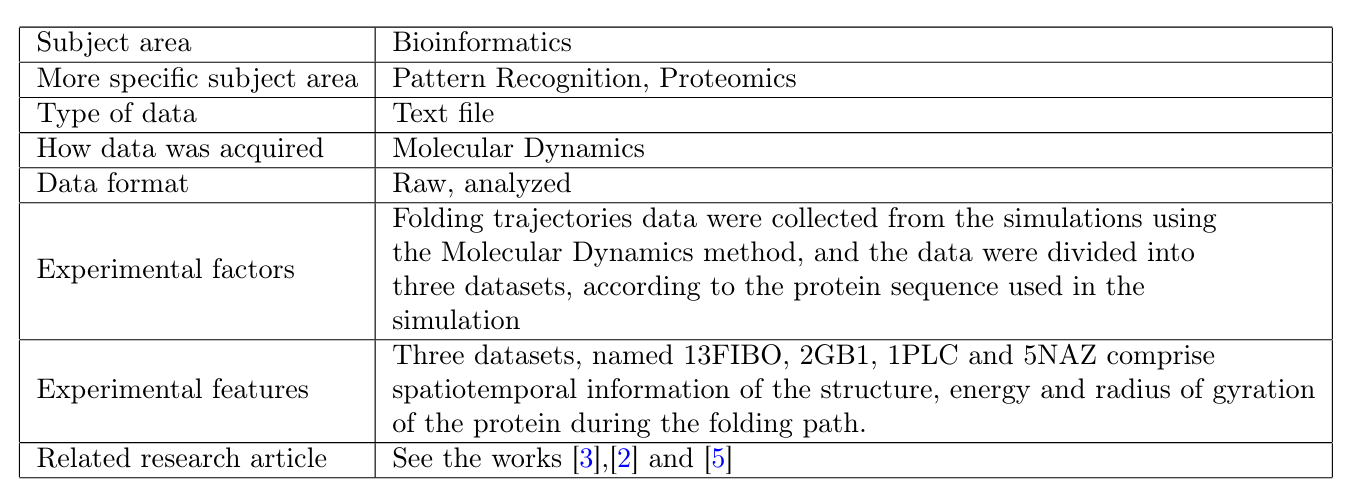
- Dataset Description:
This work reports datasets for the study of protein folding dynamics, corresponding to the spatiotemporal data of folding trajectories obtained by an in silico method.
Three datasets are described: the first one is based on the Fibonacci sequence (13FIBO) and the other two on real biological sequences (2GB1, 1PLC and 5NAZ). Each dataset is composed of 1,000 different trajectories data, each containing structural information of the protein during the folding process including the spatial coordinates of each amino acid at each time step, and the free energy and radius of gyration values for each structure.
- Specifications Table:
- Value of the Data:
The Protein Folding Problem (PFP) is an active area of research in Bioinformatics and aims at unveiling how proteins fold into their native form Dill (2012). Many methods and algorithms have been proposed to find the native structure of a protein based only in the properties of their amino acids chain. However, the dynamics of the folding process is not frequently addressed in the literature. One of the possible reasons is the lack of datasets of protein folding pathways. This work presents three datasets specially devised for this subject, thus encouraging the development of computational methods for the PFP, such as our previous work (Hattori, 2018). The datasets contain information about the structure, energy and radius of gyration, which can be used for other studies besides the PFP, such as predicting the structure based on energy and compactness, as well as prediction of amino acids contacts.
- Details of the Dataset:
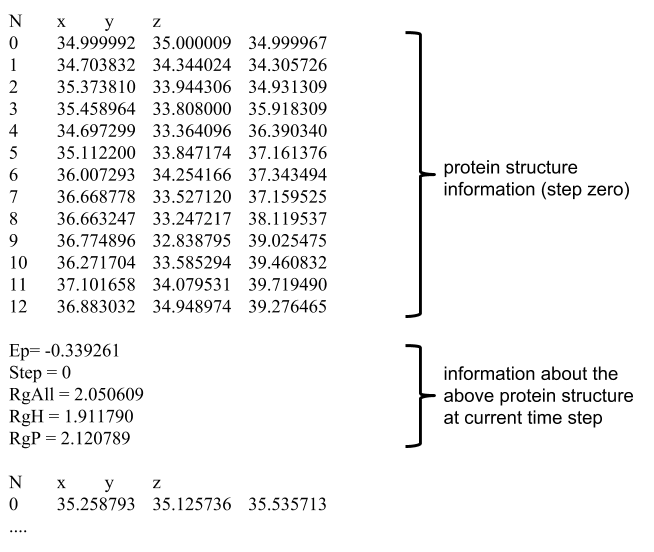
The datasets introduced here are collections of protein folding trajectories data. Each trajectory contains spatial information about the protein during the folding process. Our protein folding simulations consist of 3,000,000 iterations of the Molecular Dynamics method. See, for instance,
Benitez et al. (2015) for additional information. At each time step (step_size), all forces actuating on the protein structure are computed. As a consequence, some amino acids are attracted to or repelled from each other, eventually pushing then to another position in the 3D space. The collection of the spatial positions of amino acids along many time steps is known as a trajectory, and trajectory points are collected at each 3,000 iterations over a simulation. The potential energy, and radii of gyration were also recorded, and the file format is shown in figure bellow. All simulations start with structures randomly initialized in the 3D space, thus allowing the datasets to contain a high diversity of pathways.
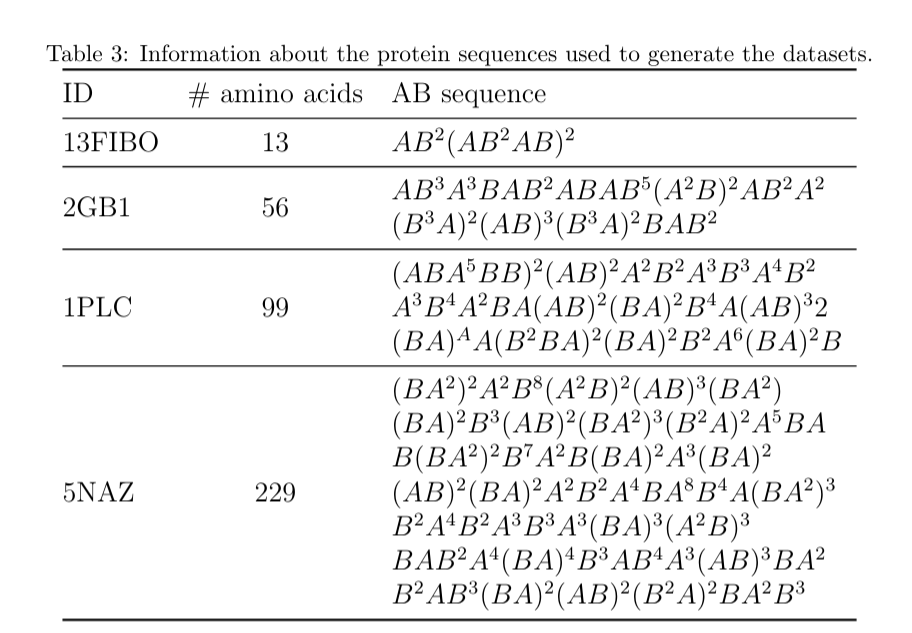
Four datasets were created, with different number of amino acids and hydrophobic sequence.
Table 3 shows the proteins' information, where A and B represents hydrophobic and polar amino acids, respectively, according to the well-known AB model. The first protein sequence (13FIBO) has 13 amino acids, and it was artificially created by distributing the hydrophobic amino acids according to the Fibonacci sequence. The other three protein sequences (2GB1, 1PLC and 5NAZ) are real proteins extracted from the Protein Data Bank (PDB).
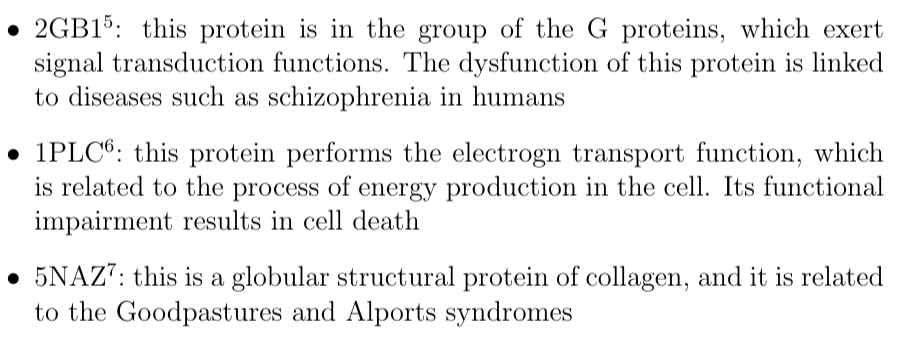
Description of the 2GB1, 1PLC and 5NAZ proteins:
13FIBO, 2GB1 and 1PLC datasets consists of 1,000 different trajectories, while the 5NAZ dataset consist of 500 trajectories, with strutures starting at random positions in the space. For each trajectory, 1,000 trajectory points were recorded, thus yelding 1,000,00 samples per dataset. Figure bellow shows examples of protein folding states.
- Data Analysis:
In order to understand the overall diversity of the data, some graphical analyses were done, and presented below.
The spatial differences between initial and final structures were analysed with heatmaps. For each dataset, all the 1,000 protein structures were compared to each other, at the first and the last step of the trajectories. The Kabsch algorithm (Kabsch, 1976solution) was used to align structures so as to allow their comparison. Results were normalized in the range $[0..1]$ and, then, plotted in a heatmap, as shown in Figures 4 and 5.
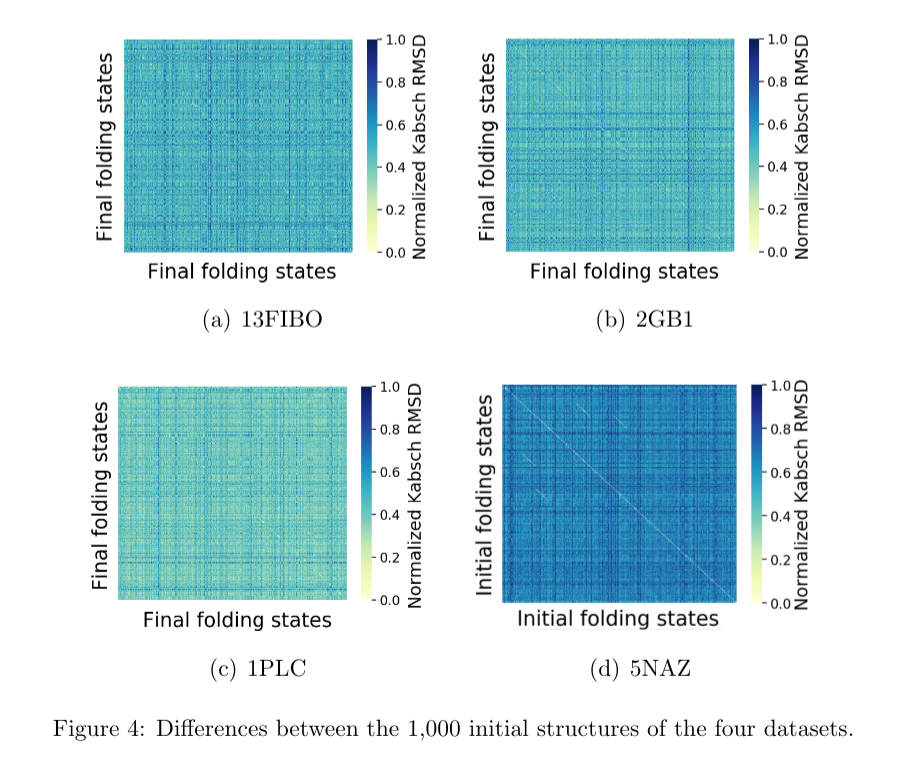
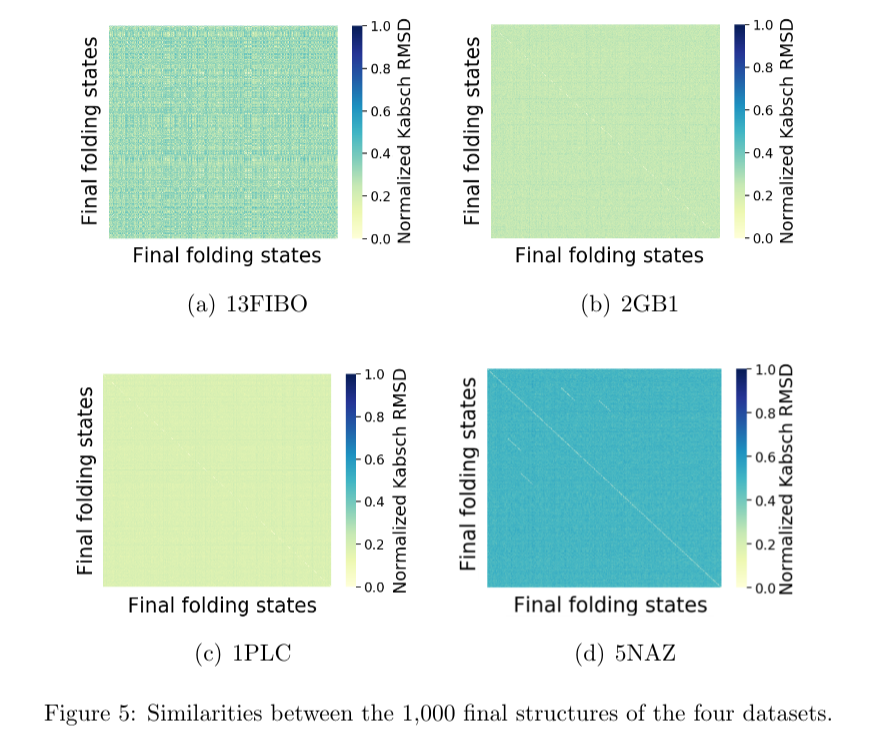
Each point of the horizontal and vertical axes of the heatmaps represents a protein structure at a given point of the trajectory (either initial of final point). The dark the color in the heatmap, the closer to 1 value it is in the Kabsch scale, meaning that the structures tend to be more different. The opposite holds, meaning similar spatial structures.
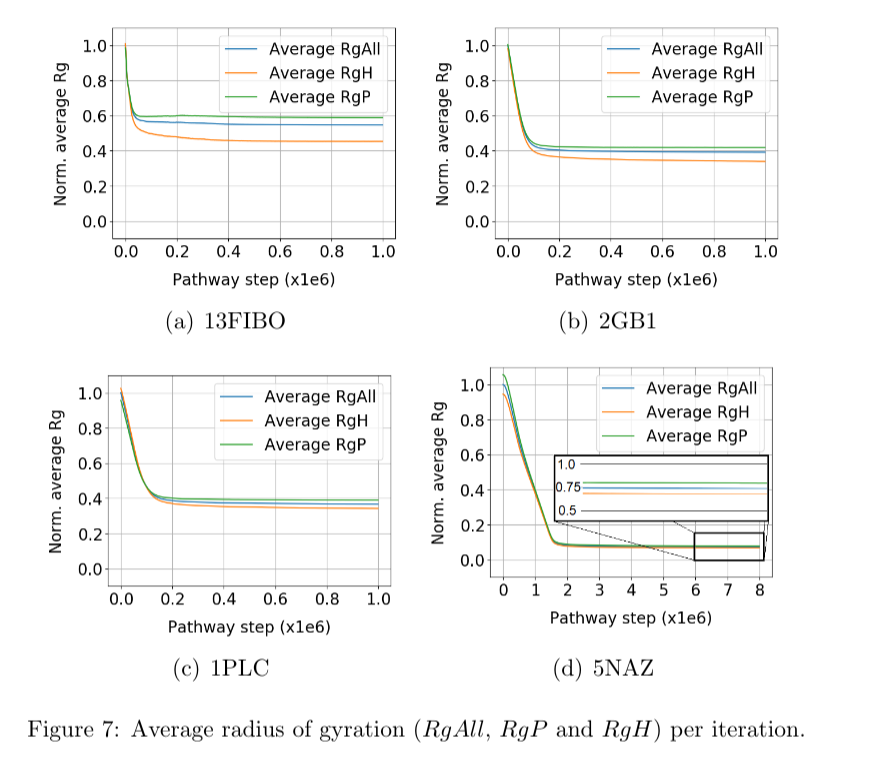
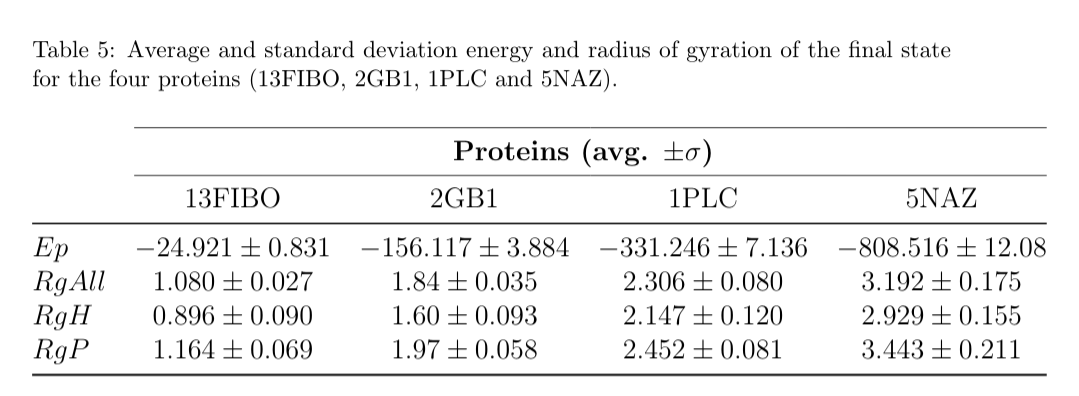
As mentioned before, values of the potential energy and radius of gyration were also computed. They give additional insights about the convergence of the protein folding process towards the native structure of a given protein. Figure 6 shows the potential energy (Ep) at each trajectory step. It is shown that the Ep starts near zero and decreases over the iterations until it stabilizes. Figure 7 shows the radii of gyration of the structure: RgP for the polar amino acids, RgH for the hydrophobic amino acids, and RgAll for the whole structure. It is shown that the three radii of gyration are high at the beginning, soon decay exponentially, and later stabilize at low values. Final values of RgH are lower than RgP, indicating the formation of a hydrophobic core, typical of globular proteins.

Additional information is provided in Table 5: the average values of the energy and radii of gyration of the final folding state for each protein.
- Links to the dataset:
1PLC.zip (1397 MB)
2GB1.zip (877 MB)
5NAZ.zip (4175 MB)
13FIBO.zip (209 MB)
- Related Paper:
L.T. Hattori, B.A. Pinheiro, R.B. Frigori, C.M.V. Benítez, H.S. Lopes.
PathMolD-AB: Generation of Spatiotemporal Pathways of Protein Folding using
Molecular Dynamics with a Coarse-grained Model. Under review (2019).